Four steps: net cost, first-year saving, simple payback, the honest payback
Payback is the point where the money saved on electricity equals what the system cost, and there are two honest ways to find it. The simple payback divides the net cost by the first year's saving and stops there — easy to quote, easy to compare, and it understates the return, because it freezes the electricity price. The inflation-adjusted payback grows each year's saving by the assumed price rise and shrinks the output by the panels' degradation, then adds the years up until the running total reaches the net cost:
net cost ($) = system cost × (1 − incentive)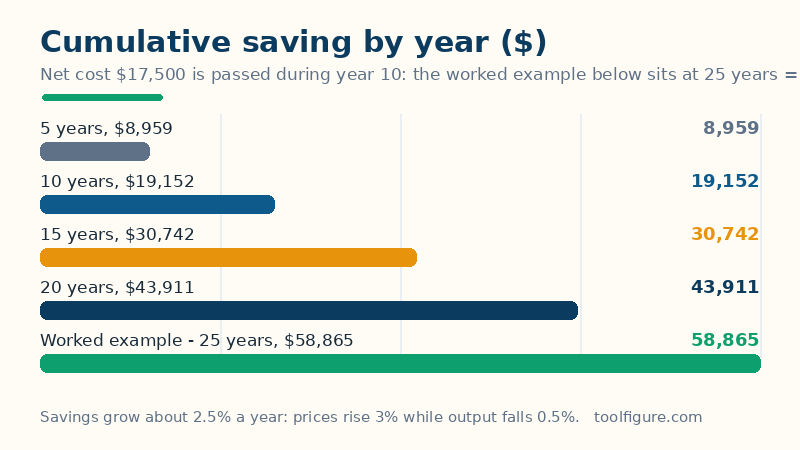
first-year saving ($) = annual production × electricity rate − maintenancesimple payback (years) = net cost ÷ first-year savingyear-t saving ($) = production × (1 − degradation)^(t−1) × rate × (1 + price rise)^(t−1) − maintenancelifetime net gain ($) = total saving over the system life − net costROI (%) = lifetime net gain ÷ net cost × 100The price rise and the degradation pull in opposite directions: a 3% annual rise in electricity prices against 0.5% annual output loss means each year's saving still grows by about 2.5% a year, so the adjusted payback lands sooner than the simple one. Maintenance is subtracted every year because it is a real cost — a system that saves $1,800 of electricity and costs $100 a year to keep is saving $1,700, not $1,800, and the payback is measured on the $1,700.
Worked example: $25,000 system, 30% incentive, 10,000 kWh a year
A $25,000 system with a 30% incentive costs $17,500 net. It makes 10,000 kWh a year at $0.18 per kWh, so the first year's gross saving is $1,800 and, after $100 of maintenance, the net first-year saving is $1,700. Simple payback = $17,500 ÷ $1,700 = 10.29 years. With prices rising 3% a year and output falling 0.5% a year, the savings reach $17,500 during the tenth year — $17,007 after nine years, then $2,145 in year ten — so the inflation-adjusted payback is 9.23 years, about a year sooner than the simple figure. Over the 25-year system life the savings total $58,865, a net gain of $41,365 after the $17,500 cost, a 236.4% return — and by year 25 the annual saving itself has grown to $3,144, because the 3% price rise outruns the 0.5% degradation. The calculator's table shows the running total along the way: $8,959 after 5 years, $19,152 after 10, $30,742 after 15, $43,911 after 20. The same arithmetic at other electricity rates, holding the $17,500 net cost, 10,000 kWh and $100 maintenance fixed, shows why the rate dominates everything: at $0.30/kWh the simple payback is 6.03 years, at $0.25 it is 7.29, at $0.18 it is 10.29, at $0.13 it is 14.58 and at $0.10 it is 19.44. Two published worked examples land on the same method: one solar ROI guide's $13,000 net system saving $1,560 a year pays back in 8.33 years, and another's $17,500 net system against a $180-a-month bill ($2,160 a year, before maintenance) pays back in 8.10 years.
How to read your result, and its limits
Four cautions keep the number honest. First, the incentive in the worked example is an example, not a promise: incentives vary by state and utility, and the US federal residential clean energy credit ended for systems installed after 31 December 2025 under the July 2025 tax law — enter the incentive that actually applies to your own installation, and check it against your state or utility programme rather than a headline rate. Second, exported electricity is usually worth less than offset electricity: this page values every kilowatt-hour at your retail rate, which is right for the share you use yourself and generous for the share you export at a lower feed-in rate — a home that exports half its output at a third of the retail rate will wait noticeably longer than this page says, and a battery, which the solar battery size calculator sizes, is what turns exported kilowatt-hours back into offset ones. Third, the price rise is a guess: the US average has run roughly 2–4% a year, but a 0% rise would leave the worked example at its 10.29-year simple payback, and a faster rise would pull it in further — the adjusted figure is only as good as the rate you enter. Fourth, payback is not the whole return: a system that pays back in 10 years still has 15 warranted years of near-free electricity after it, and the lifetime net gain is the figure that captures that — which is why this page shows both. For the system size behind the production figure, the solar panel calculator sizes the array from your own bill; for what each kilowatt-hour is worth once the panels are running, the electricity cost calculator prices it at your own rate.
Common mistakes
- Quoting the simple payback as the whole story. It freezes the electricity price for 25 years. With prices rising, the real payback is sooner — 9.23 years against 10.29 in the worked example — and quoting only the simple figure understates the investment.
- Forgetting maintenance and degradation. A $100-a-year maintenance cost and 0.5% annual output loss are small lines, but leaving them out flatters every figure on the page. Both are in the model here, and both are adjustable.
- Valuing exported power at the retail rate. A kilowatt-hour you use yourself saves the full retail rate; a kilowatt-hour you export may earn a third of it. Homes with big daytime export need the feed-in rate in the maths, or the payback they plan on will not arrive.
- Comparing payback across different system sizes. A bigger system costs more and saves more; the payback period is roughly size-independent, so compare systems on lifetime net gain and ROI, not on which one pays back a few months sooner.
Frequently asked questions
How long does it take for solar panels to pay for themselves?
Typically 6 to 10 years for a US home, depending on the system cost, the electricity rate, the sunlight and the incentives. In the worked example — a $25,000 system, 30% incentive, 10,000 kWh a year at $0.18/kWh — the inflation-adjusted payback is 9.23 years and the simple payback 10.29 years, with 15 more warranted years of savings after that.
What is the difference between simple payback and inflation-adjusted payback?
Simple payback divides the net cost by the first year's saving and freezes the electricity price. Inflation-adjusted payback grows each year's saving by the assumed price rise and shrinks output by panel degradation, then adds the years until the running total reaches the net cost. In the worked example the simple figure is 10.29 years and the adjusted figure 9.23 years.
Does the 30% federal tax credit still apply to solar?
Not for new US residential installations: the federal residential clean energy credit ended for systems installed after 31 December 2025 under the July 2025 tax law, so check your state and utility incentives instead. The 30% in this page's worked example is an example figure — enter the incentive that actually applies to your own installation.
Why is my payback longer than the installer's quote?
Installer quotes often use the simple payback with no maintenance or degradation, value every kilowatt-hour at the full retail rate even when much of it is exported cheaply, and assume a fast price rise. This page includes maintenance and degradation and states its assumptions, so a longer figure here is usually the more careful one — check which assumptions differ before deciding the quote was wrong.