Percent error is a measurement graded against the truth
Every measurement misses. A scale reads 9.6 where the standard weight is exactly 10; a student's experiment produces 9.75 for a constant the textbook gives as 9.81; a forecast says 105 for a figure that lands at 100. The raw gap — 0.4, 0.06, 5 — means little until it is set against the size of the thing measured, which is what percent error does: it expresses the miss as a percentage of the accepted value, so a 0.4 miss on a value of 10 (4.00%) and a 0.4 miss on a value of 10,000 (0.004%) stop looking like the same mistake. It is the standard grading figure in school and university labs, in instrument calibration and in forecast scoring, and it is a different question from the one the percent change calculator answers: percent change compares two ordinary values, neither of them "true", while percent error needs one value that is accepted as the reference. When no such reference exists, the honest tool is percent difference, covered in the questions below.
The formula, with every term defined
Percent error = |experimental − theoretical| ÷ |theoretical| × 100Signed error = experimental − theoreticalSigned percent error = signed error ÷ |theoretical| × 100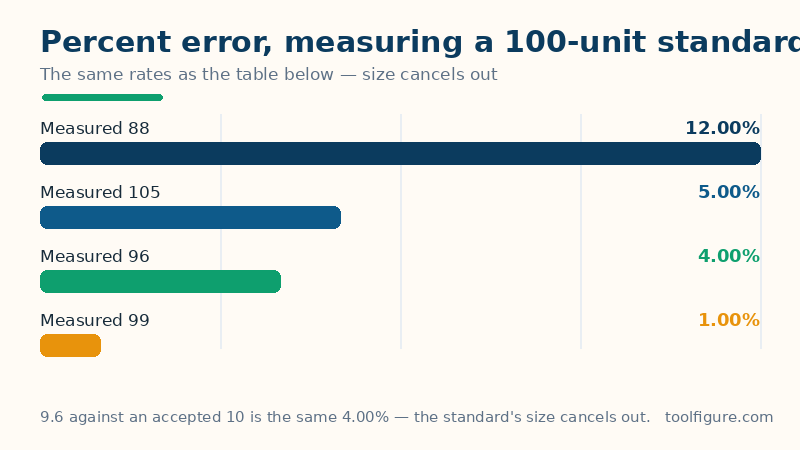
The experimental value is the one that came from a measurement, an experiment or a forecast — the value being graded. The theoretical value is the accepted reference: a standard weight, a textbook constant, an audited final figure. It is always the base of the percentage, because the question being asked is "how big is the miss, compared with what the answer should have been?" — dividing by the measured value instead answers a different question and gives a different, wrong-for-this-purpose number (the worked example's 0.4 gap divided by the measured 9.6 gives 4.17%, not 4.00%). The bars in the formula are absolute values: the headline percent error is never negative, because it reports a size. Direction is not thrown away, though — it lives in the signed error and the signed percent error, which keep the plus or minus so you can see whether the measurement ran high or low. The denominator carries bars too, so an accepted value that is itself negative — a temperature of −10 degrees, a loss of −50 — still produces a sensible percentage.
Worked example: 9.6 measured against an accepted 10
The defaults above enter a measured value of 9.6 against an accepted value of 10 — a calibration weight that should read exactly 10 on a healthy scale. The signed error is 9.6 − 10 = −0.4: the minus sign says the reading ran low. The absolute error is 0.4. Divide by the accepted value: 0.4 ÷ 10 = 0.04, and × 100 gives a percent error of 4.00%, with a signed percent error of −4.00%. The check row closes the loop: accepted + signed error = 10 + (−0.4) = 9.6 — the accepted value, corrected by the signed error, rebuilds the measurement exactly. Nothing about the 10 matters except as the base: measure 96 against an accepted 100 and every figure scales up tenfold while the percent error stays exactly 4.00%, which is the chart's point near the top of this page.
Percent error at other sizes
| Measured | Accepted | Signed error | Percent error | Direction |
|---|---|---|---|---|
| 105 | 100 | 5 | 5.00% | Above |
| 51 | 50 | 1 | 2.00% | Above |
| 130 | 100 | 30 | 30.00% | Above |
| 9.6 — worked example | 10 | −0.4 | 4.00% | Below |
| 0.48 | 0.50 | −0.02 | 4.00% | Below |
| 24.8 | 25 | −0.2 | 0.80% | Below |
| 198 | 200 | −2 | 1.00% | Below |
| 75 | 100 | −25 | 25.00% | Below |
| 9.75 (a measured g) | 9.81 | −0.06 | 0.61% | Below |
Two rows repay a second look. The 0.48 against 0.50 row lands on exactly the worked example's 4.00% — the numbers shrank twentyfold and the percentage did not move, because percent error is about the proportion of the miss, not its size. And the gravity row shows what a good school-lab result looks like: a measured 9.75 against the accepted 9.81 is out by only 0.61%, the kind of figure lab reports are usually hoping to get under 5% or even 1%. Notice, too, what the table never does: no row's percentage is computed from the measured column. Swap the base on the 24.8 row and 0.2 ÷ 24.8 gives 0.81% instead of 0.80% — a small lie at this size, and a large one when the miss is large.
Reading a percent error honestly — the limits
Four cautions belong with any figure from this page. The accepted value has to deserve the name. Percent error grades against a reference that is treated as true; if both numbers are just two measurements of the same thing, neither is the base, and dividing by one of them manufactures a verdict the data does not support — that case is percent difference, with the average as the base. Small accepted values explode the percentage. A miss of 0.4 is 4.00% of 10 but 400% of 0.1, and at an accepted value of exactly 0 the percentage is undefined at any miss size — the calculator refuses and points you to the absolute error, which is the only honest figure there. Percent error says nothing about consistency. Five readings of 9.6, 10.4, 9.6, 10.4 and 10.0 average out near the truth while scattering widely; that scatter is precision, measured by spread — the standard deviation calculator — and a single percent error cannot see it. And a low percent error is not automatically a good result: it certifies closeness on this one comparison, under these conditions. An instrument can be 0.61% out at one point of its range and far worse at another, which is why calibration checks several points rather than celebrating one.
Frequently asked questions
What is percent error, in plain words?
How far a measured value sits from the accepted value, expressed as a percentage of the accepted value. A measurement of 9.6 against an accepted 10 is out by 0.4, and 0.4 is 4.00% of 10 — so the percent error is 4.00%. The percentage is what makes errors comparable: the same 0.4 miss against an accepted value of 10,000 would be an error of just 0.004%.
Why divide by the accepted value and not the measured one?
Because the accepted value is the reference the measurement is graded against — the question is 'how big is the miss compared with what the answer should have been?' Dividing by the measured value answers a different question and moves the figure: the worked example's 0.4 gap divided by the measured 9.6 gives 4.17%, not the correct 4.00%. The bigger the miss, the bigger the distortion, which is why textbooks and lab guides are strict about the base.
Can percent error be more than 100%?
Yes — whenever the miss is bigger than the accepted value itself. A measurement of 25 against an accepted 10 is out by 15, which is 150.00% of 10. The extreme case in the other direction is a measurement of 0 against any accepted value: the miss equals the whole value, so the percent error is exactly 100.00%. Figures over 100% usually mean the measurement failed outright rather than merely drifted, but the arithmetic is sound.
What is the difference between percent error and percent difference?
Whether one of the values is accepted as true. Percent error divides the gap by that true value: 96 against a true 100 is an error of 4.00%. Percent difference is for two values neither of which is the reference — two instruments, two methods — so it divides by their average instead: 96 and 100 differ by 4, the average is 98, and the percent difference is 4.08%. Use error when a standard exists, difference when you are only comparing.
What if the accepted value is 0?
Then percent error does not exist for that comparison — the formula divides by the accepted value, and no percentage of zero can describe a miss. A measured 0.3 against a true 0 has an absolute error of 0.3 and no meaningful percent error. This calculator says so plainly instead of printing an infinite or invented figure; report the absolute error, in the original units, for any comparison whose true value is zero.