How far from average — measured in standard deviations
A raw score means little until you know the group it came from: 85 on a test the class averaged 70 on is a strong result; 85 where the average was 84 is ordinary. The z-score makes that judgement exact and portable. It states how many standard deviations a value sits from the mean of its group — one number, stripped of the original units, so a test score, a height and a day's temperature can be compared on the same scale. A z-score of +1.5 always means the same thing: one and a half standard deviations above average, higher than about 93% of a normally distributed group. This page computes the z-score and then reads the normal curve for you: the percentile, the share of the group below and above the value, the share lying within that many standard deviations of the mean, and the landmark values one and two standard deviations out, which frame where the value sits. The two inputs it needs — the mean and the standard deviation — are exactly what our standard deviation calculator produces from a raw list, and the average calculator explains the mean beside its cousins the median and mode; this page takes over from the point where those summaries exist and a single value needs judging against them.
The formula, with every term defined
z = (x − μ) ÷ σPercentile = Φ(z) × 100, where Φ is the normal curve's cumulative share up to z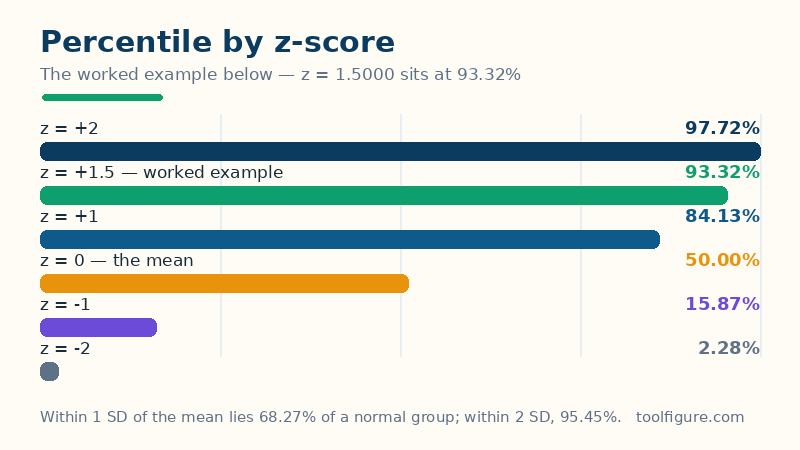
Read it in words. x is the value being judged. μ (mu) is the mean of its group, and σ (sigma) is the group's standard deviation — its typical spread around the mean. The numerator, x − μ, is the plain distance from average, still in the original units: marks, centimetres, dollars. Dividing by σ converts that distance into standard-deviation units, and the units cancel — which is why z-scores from wholly different measurements can share one table. The sign is the direction: positive above the mean, negative below, zero exactly on it. The percentile then asks the normal curve what share of the group lies at or below that z: Φ, the cumulative distribution, is the area under the bell curve to the left of the value. The familiar landmarks come straight from that area — within ±1σ of the mean lies 68.27% of a normal group, within ±2σ lies 95.45%, and within ±3σ lies 99.73%, the 68–95–99.7 rule that the landmarks in the results table are built from.
Worked example: a score of 85 where the mean is 70 and σ is 10
The defaults above enter a value of 85, a mean of 70 and a standard deviation of 10 — a strong test result. The distance from the mean is 85 − 70 = +15 marks, and 15 ÷ 10 gives a z-score of 1.5000: the score sits exactly one and a half standard deviations above average. Reading the normal curve at 1.5000, the share below is Φ(1.5) = 0.9332, so the score is at the 93.32nd percentile — about 93.32% of the group scored at or below it, and 6.68% scored above. The two shares sum to exactly 1, as they must. The symmetry rows close the example: 86.64% of a normal group lies within ±1.5σ of the mean, leaving 13.36% outside in the two tails together (86.64 + 13.36 = 100). The landmarks frame the score in raw marks — the mean minus 2σ is 50, minus 1σ is 60, plus 1σ is 80 and plus 2σ is 90 — so 85 sits between the +1σ and +2σ landmarks, nearer their middle, which is precisely what z = 1.5 says in numbers. The chart near the top draws the percentile ladder this example sits on: each whole standard deviation climbs from 2.28% at z = −2 to 97.72% at z = +2.
The percentile ladder, and three more values judged
| Z-score | Share below | Percentile |
|---|---|---|
| −3.0000 | 0.0013 | 0.13% |
| −2.0000 | 0.0228 | 2.28% |
| −1.0000 | 0.1587 | 15.87% |
| −0.5000 | 0.3085 | 30.85% |
| 0.0000 — the mean itself | 0.5000 | 50.00% |
| +0.5000 | 0.6915 | 69.15% |
| +1.0000 | 0.8413 | 84.13% |
| +1.5000 — worked example | 0.9332 | 93.32% |
| +2.0000 | 0.9772 | 97.72% |
| +2.5000 | 0.9938 | 99.38% |
| +3.0000 | 0.9987 | 99.87% |
The ladder is symmetric: a z of −1 leaves 15.87% below, exactly the share that lies above +1. Three real judgements use it. An IQ of 115 against the test's mean of 100 and σ of 15 gives z = +1.0000 — the 84.13th percentile, one standard deviation above average, which is how such tests are designed to be read. A height of 190 cm in a group averaging 175 cm with σ = 7 cm gives z = 15 ÷ 7 = 2.1429, the 98.39th percentile — taller than all but about 1.61% of the group. And a score of 60 on the worked example's own test (mean 70, σ 10) gives z = −1.0000, the 15.87th percentile: below average by a full standard deviation, the mirror image of the IQ case. Note what the ladder also teaches — percentiles crowd near the middle and stretch at the edges. Moving from z = 0 to z = +0.5 gains 19.15 percentile points; moving from +2.5 to +3.0 gains only 0.49, because there is almost nobody left out there to pass.
Reading a z-score honestly — the limits
Three cautions belong with any result here. The percentile assumes a normal shape. The z-score itself is pure arithmetic and always valid, but converting it to a percentile reads the bell curve — exact when the group is roughly normally distributed (heights, measurement errors, standardised tests built to be normal) and misleading when it is not. Incomes, for example, pile up at the low end with a long tail upward; a z of +2 in income is nowhere near the 97.72nd percentile of actual earners. When the shape is skewed, rank the value in the real data instead. Outliers bend both inputs. The mean and standard deviation are themselves dragged by extreme values, so one wild figure can shrink everyone else's z-scores; the standard deviation page explains the effect and when the median describes a group better. And a z-score is relative, not good or bad. It locates a value inside its group and says nothing about whether the group's level is high, low, safe or dangerous — z = +2 on a weak class's test and z = +2 on a national examination are the same position in very different companies. Use it to compare standing, then judge the standing's worth separately.
Frequently asked questions
What is a good z-score?
There is no universally good value — it depends which direction is desirable and how selective you want to be. On a test, higher is better and z = +1.5000 (the worked example) already beats about 93% of the group; z = +2 passes about 97.72%. In quality control the desirability flips: a measurement near z = 0 is good and anything beyond ±3 (outside the middle 99.73%) triggers investigation. In growth charts both tails matter. The z-score reports the position; 'good' is a judgement about the situation, and this page deliberately leaves it to you.
What does a negative z-score mean?
Simply that the value sits below its group's mean, by that many standard deviations. A score of 60 against a mean of 70 with σ = 10 gives z = −1.0000 — one standard deviation below average, the 15.87th percentile. Negative is not an error and not automatically bad: a negative z for a golf score, a waiting time or a blood-pressure reading can be exactly what you want. The sign carries direction, the size carries how unusual the value is, and the two readings are separate.
What z-score is the 90th percentile?
About 1.2816. The percentile ladder runs in both directions: find the z whose share-below is 0.9000 and it is 1.2816, just as the 97.5th percentile sits at the famous 1.9600 and the 99th at 2.3263. Those reverse landmarks are why exam boards and growth charts can state a threshold either way — as a percentile to reach, or as the z-score that reaches it.
Is a percentile the same as a percentage score?
No — they answer different questions and confusing them is the commonest z-score mistake. A percentage score says how much of the test you got right: 85% correct is a mark. A percentile says where you stand among people: the 93.32nd percentile means about 93.32% of the group scored at or below you. A hard test can give a low percentage score and a high percentile at once — 55% correct might top the class — and a z-score belongs to the second world, standing, not to the first, marks.
Why can the standard deviation not be zero or negative?
Because of what it measures: a typical distance from the mean. Distances are never negative, so σ never is; and σ = 0 would mean every value in the group is identical to the mean — there is no spread, so 'how many standard deviations away' has no answer, like asking how many zero-length steps a journey takes. If your data really has no spread, every value's standing is simply 'equal to the mean' and no calculator is needed. A zero or negative σ entry is always a data error — usually the variance (σ squared) or a range typed into the wrong box.