A percentage, not just a weight: what the tape can tell you
Two people can weigh exactly the same and be built completely differently — one carrying mostly muscle, the other mostly fat — and the scale cannot tell them apart. Body fat percentage can: it is the share of your weight that is fat tissue, and it is the number behind most sensible fitness and health goals. This calculator estimates it with the US Navy circumference method, developed for the US Navy in the 1980s (Hodgdon and Beckett) so sailors could be assessed with nothing but a tape measure. It needs your height and the circumference of your neck and waist — plus your hip if you are a woman — and it returns the percentage, your category, and, if you add your weight, the split between fat mass and lean mass. It is an estimate for general information, not a medical measurement.
The formula, with every term defined
Men: body fat % = 495 ÷ (1.0324 − 0.19077 × log₁₀(waist − neck) + 0.15456 × log₁₀(height)) − 450Women: body fat % = 495 ÷ (1.29579 − 0.35004 × log₁₀(waist + hip − neck) + 0.22100 × log₁₀(height)) − 450All measurements in centimetres. Fat mass = weight × body fat % ÷ 100 · Lean mass = weight − fat mass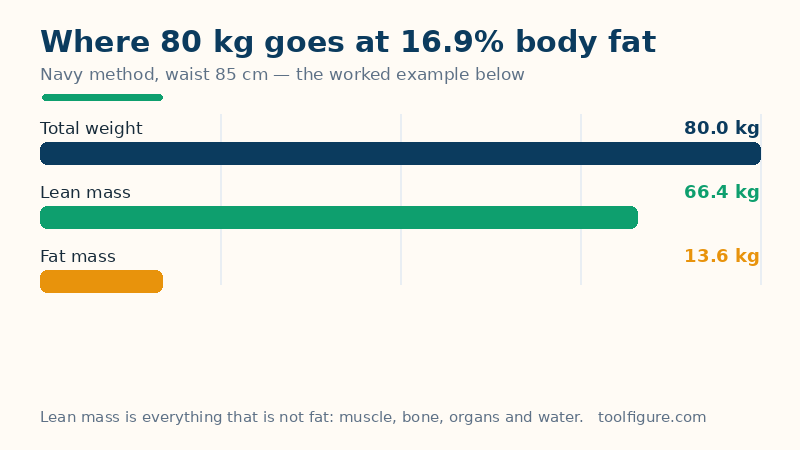
The logic inside the constants is plain. The waist carries most of the body's changeable fat, so it drives the result; the neck is subtracted because it grows with overall frame and muscle rather than fat, which partly corrects the waist for build; height scales the whole thing to your size. The women's version adds the hip for the same reason — fat distribution differs, and one circumference cannot describe both patterns. The logarithms are there because circumferences grow more slowly than the volume they surround. Measure carefully: tape flat against the skin, snug but not compressing, at the points named beside each field — a centimetre of tape error moves the answer, as the worked example shows.
Worked example: a man of 175 cm, neck 38 cm, waist 85 cm, 80 kg
The defaults above give: waist − neck = 85 − 38 = 47 cm, and log₁₀(47) ≈ 1.6721; log₁₀(175) ≈ 2.2430. The denominator is 1.0324 − 0.19077 × 1.6721 + 0.15456 × 2.2430 = 1.0324 − 0.3190 + 0.3467 = 1.0601, so body fat = 495 ÷ 1.0601 − 450 = 16.9% — inside the Fitness band for men. At 80 kg that splits into about 13.6 kg of fat mass and 66.4 kg of lean mass. Now the caution, in numbers: the same man with a 95 cm waist reads 24.1% (top of Average) and with a 75 cm waist 8.4% (Athletes) — ten centimetres of waist is worth roughly eight percentage points, so one sloppy measurement can move you two categories. The page also shows a cross-check from a completely different method: the BMI-based Deurenberg formula estimates this body at 22.0%. The gap is not a bug in either method — Deurenberg infers fat from height and weight alone and cannot see that this waist is relatively lean for the weight; the Navy method measures the waist directly. A woman's cross-check: 165 cm, neck 32 cm, waist 75 cm, hip 95 cm and 65 kg gives 27.4% by the Navy method (Average band for women; about 17.8 kg fat, 47.2 kg lean) against 30.2% by Deurenberg.
The category bands (ACE)
| Category | Men | Women |
|---|---|---|
| Essential fat | 2–5% | 10–13% |
| Athletes | 6–13% | 14–20% |
| Fitness | 14–17% | 21–24% |
| Average | 18–24% | 25–31% |
| Obese | 25%+ | 32%+ |
These are the widely used American Council on Exercise bands. Women's bands sit higher because essential fat — the minimum the body needs for normal hormonal and reproductive function — is genuinely higher; dropping towards the essential floor is not a fitness achievement, it is a health risk, and no target should be set there without medical supervision. The bands are descriptive ranges for adults, not grades: an Athletes-band figure reached by illness is not health, and an Average-band figure in an otherwise fit, active person is not a diagnosis.
How to read your result, and the limits — read these
Use the number as a trend instrument: measured the same way, at the same time of day, the Navy method is consistent enough to show real change over weeks even if the absolute figure is a few points off. Its honest accuracy against laboratory methods (DEXA, hydrostatic weighing) is usually quoted at about ±3–4 percentage points for typical bodies, and worse at the extremes — very lean athletes and people with obesity are the bodies tape methods describe least well, because fat distribution stops following the average pattern the constants were fitted to. Gut content, hydration and a hard training session all move waist readings slightly. The figure also says nothing about where fat sits, and visceral fat around the organs carries different risks from fat under the skin — one more reason a tape estimate starts conversations rather than settling them. If body composition genuinely matters to your health, a clinician or a DEXA scan is the next step; for tracking your own progress, re-measure monthly and trust the direction, not any single reading. The BMI calculator gives the simpler height-and-weight screening figure most doctors start from, and the BMR calculator can turn lean mass like the figure above into a resting-energy estimate.
Frequently asked questions
How accurate is the Navy body fat method?
Against laboratory methods such as DEXA and hydrostatic weighing, the Navy circumference method is usually within about 3–4 percentage points for typical adult bodies — good enough to place you in the right category band and to track change over time, not good enough to treat the decimal as exact. It is least accurate for very lean athletes and for people with obesity, whose fat distribution differs most from the populations the formula was fitted on. Careful measuring matters more than the formula: in the worked example, 10 cm of waist error moves the result by about 8 points.
How do I measure correctly for this calculator?
Use a flexible tape, flat against the skin, snug but not digging in, and measure at the same time of day each time. Neck: just below the Adam's apple, tape sloping slightly down to the front. Waist: for men, horizontally at the level of the navel; for women, at the narrowest point of the waist. Hip (women only): the widest point of the hips and buttocks. Take each measurement twice and use the average if they differ, and record the figures — the trend over months is the useful output.
What is a healthy body fat percentage?
The widely used ACE bands put the Fitness range at 14–17% for men and 21–24% for women, with Average at 18–24% and 25–31% respectively. Women's figures are higher at every level because essential fat — the minimum needed for normal hormonal function — is 10–13% for women against 2–5% for men. Healthy varies with age, sport and medical history, so treat the bands as orientation and discuss any real concern with a clinician rather than chasing the bottom of a table.
Why does the BMI-based cross-check disagree with the Navy result?
Because they look at different evidence. The Deurenberg cross-check infers body fat from your BMI and age alone — it assumes an average relationship between weight-for-height and fat. The Navy method measures your waist, neck and hip directly, so it can see a lean waist on a heavy, muscular body (or the reverse). In the worked example the two differ by about five points — 16.9% versus 22.0% — which is a realistic size of disagreement between indirect methods, and a good reason to track one method consistently instead of averaging several.
What is the difference between fat mass and lean mass?
Fat mass is the weight of the fat tissue itself — 13.6 kg in the worked example. Lean mass is everything else: muscle, bone, organs, blood and water — 66.4 kg in the same example. The split matters because healthy weight change aims to reduce fat mass while keeping lean mass, and because lean mass is what drives resting energy use: the Katch-McArdle equation in the BMR calculator estimates your basal metabolic rate from lean mass directly.