How much will you actually have when you retire?
Retirement planning usually fails in one of two places: people either never run the number at all, or they run it once with heroic assumptions and never look again. This calculator keeps the question simple and honest. Tell it your age now, the age you want to stop, what you have already saved, what you can add each month and a realistic long-term return, and it projects your pot at retirement — split into the two parts that matter. The first part is money you put in yourself. The second is growth: the returns earned by your savings and, crucially, the returns earned by earlier returns. On long timescales the second part is usually the bigger one, which is why the most valuable retirement asset is not a clever investment — it is an early start and a contribution that never gets skipped. Change any figure above and the projection updates instantly, so you can test the real levers — retiring later, saving more, starting from more — instead of guessing at them.
The retirement projection formula
Pot at retirement = P(1 + r)n + PMT x [((1 + r)n - 1) / r]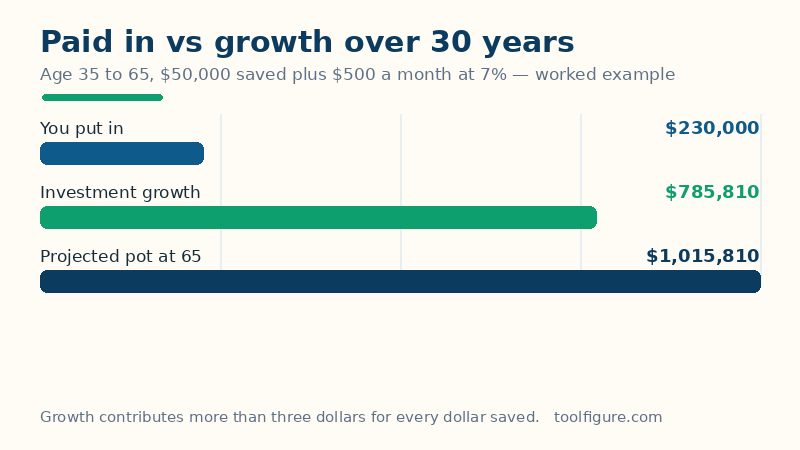
P is what you have saved already, PMT is your monthly contribution, added at the end of each month, r is the monthly return (the annual return divided by 12) and n is the months until retirement — the years between the two ages you entered, times 12. The first term grows the money you already have; the second grows every monthly deposit for the months it stays invested. It is the same engine as our compound interest calculator, framed around the two ages that define a working life. When the return is 0% the formula collapses to simple addition: savings plus contributions, nothing more — a useful floor to compare any optimistic projection against. To turn a savings target into the monthly amount it needs, use the savings goal calculator alongside this page.
Worked example: retiring at 65, starting at 35
You are 35, plan to retire at 65, have $50,000 saved and add $500 a month, earning 7% a year. Thirty years is 360 monthly steps. Your existing $50,000 alone grows to $405,825, and your 360 deposits of $500 — $180,000 of your own money — grow to $609,986. Projected pot at 65: $1,015,810. Now look at the split, because it is the whole lesson of this page: you put in $230,000 in total, and growth contributes $785,810 — more than three dollars of growth for every dollar you save. That is not a promise about markets; it is simply what three decades of compounding does at a steady 7%, and it is why the projection is so sensitive to the two inputs you control completely: how many years your money gets, and whether the monthly contribution actually happens every month.
The five-year swing: earlier vs later retirement
Same saver, same $500 a month, same 7% — only the retirement age moves. Retiring at 60 instead of 65 cuts the pot to $691,307: five fewer years of contributions and, far more importantly, five fewer years for the largest balance of your life to compound. Retiring at 70 lifts it to $1,475,835. The gap between 60 and 70 is more than three quarters of a million dollars, and almost none of it comes from the extra deposits — it comes from time. This is also why a late start is expensive but not hopeless: someone starting at 45 with nothing saved who wants the same result must contribute far more each month, because their money gets 20 years of growth instead of 30. The calculator will show you your own version of this trade-off in seconds; try moving your retirement age by two years before you move anything else, and watch which lever your plan is really hanging on.
What return should you honestly enter?
The return is the one input nobody controls, so treat it with suspicion — including your own optimism. Long-run returns on a diversified stock portfolio have historically been quoted in the high single digits before inflation, while cash and high-quality bonds return less. A practical approach: run the projection at three rates — a cautious one, a middle one and an optimistic one — and plan your life around the cautious figure, treating anything above it as a bonus. Remember also what this calculator leaves smooth: real returns arrive in lumps, with bad years often clustered near the start or the end, and a crash just before retirement hurts more than the same crash at 40. It assumes one fixed rate, monthly contributions that never pause, no taxes on growth, no fees and no inflation — so the pot it shows is in today's purchasing power only if the return you entered is already net of inflation. Compare the monthly contribution against your real take-home pay from the paycheck calculator, and if your savings sit in interest-bearing accounts today, our APY calculator shows what those rates are genuinely worth.
Frequently asked questions
How much money do I need to retire?
There is no single figure — it depends on the spending you want to fund, for how many years, and what income you will already have from pensions or Social Security. A common planning shortcut is to target a multiple of your annual spending rather than your salary. This calculator answers the other half of the question: given your age, savings and monthly contribution, how large a pot your current plan is on track to build.
How is the retirement pot calculated?
Your existing savings are grown month by month at your expected return, and each monthly contribution is added and grown for the months it remains invested: Pot = P(1 + r)^n + PMT x [((1 + r)^n - 1) / r]. At 35, retiring at 65 with $50,000 saved, $500 a month and a 7% return, that gives $1,015,810 — $230,000 paid in and $785,810 of growth.
What annual return should I assume?
Use a cautious long-term figure you can defend, and test a range rather than a single number. Projections are highly sensitive to this input over 30 years: the difference between 5% and 7% on the worked example is hundreds of thousands of dollars. If your savings are in cash accounts, enter the account's actual APY; for investments, a mid-single-digit assumption is more honest than the best decade you can find.
How much does retiring 5 years later really add?
More than most people expect, because the final years carry the largest balance. In the worked example, retiring at 70 instead of 65 raises the pot from $1,015,810 to $1,475,835 — and retiring at 60 cuts it to $691,307. Most of that swing is lost or gained compounding time, not the extra contributions.
Does this calculator include Social Security or a state pension?
No — deliberately. It projects only the pot you build from your own savings and contributions. Guaranteed income such as Social Security or a workplace pension reduces the spending that pot needs to cover, so treat the projected figure as the private savings part of your retirement, and get a benefit estimate from the official source for the rest.