One question, three honest answers: how much, how many times, how fast
Return on investment — ROI — is the comparison every investment pitch eventually comes down to: what came back, set against what went in. It sounds like one number, but it quietly answers three different questions, and confusing them is how mediocre returns get dressed up as good ones. The profit says how much money was made. The ROI percentage says how hard each dollar worked, which is what makes a $1,000 gain on $2,000 (50%) a better return than the same $1,000 on $20,000 (5%). And the annualised ROI says how fast it happened — because 50% earned in one year and 50% earned in ten years are the same headline and completely different investments. This calculator reports all three, plus the growth multiple, so no one of them can flatter the result on its own. It is the natural companion to the compound interest calculator: that page projects growth forwards, this one scores a finished — or current — investment backwards.
The formulas, with every term defined
Profit = final value − amount invested · ROI % = profit ÷ amount invested × 100Growth multiple = final value ÷ amount invested · Annualised ROI % = ((final ÷ invested)1 ÷ years − 1) × 100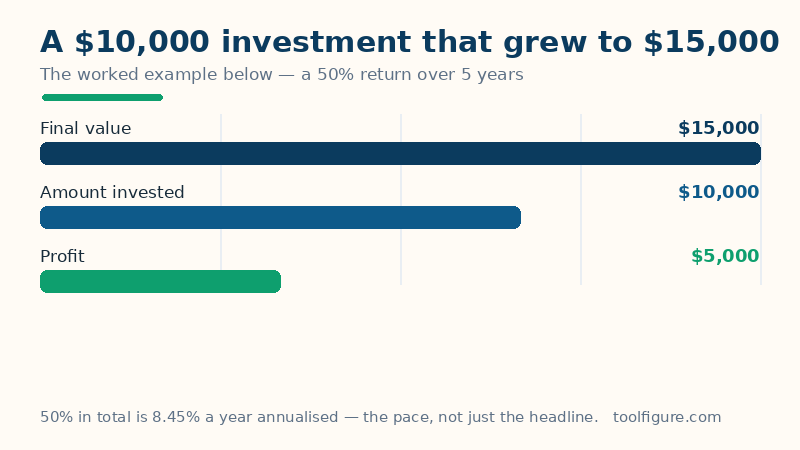
Read it in words. The amount invested is everything it cost to get in: price plus buying fees and any money added later that you want counted. The final value is everything that came out: the sale price after selling fees, or today's value if you still hold it, plus any dividends, interest or rent you choose to count. The profit is simply the difference, and dividing it by what went in turns it into a percentage that can be compared across investments of any size. The growth multiple restates the same result as a multiplier — 1.50x means every dollar became a dollar fifty, and a multiple below 1.00x means money was lost. The annualised ROI is the subtle one: it finds the single steady yearly rate which, compounded for the years held, would carry the starting amount to the same final value. It is not the total divided by the years — compounding means each year's growth builds on the last, so the annualised rate is always lower than that simple average for a gain, as the worked example shows.
Worked example: $10,000 grows to $15,000 in five years
The defaults above enter $10,000 invested, a final value of $15,000, and 5 years held. The profit is 15,000 − 10,000 = $5,000. The ROI is 5,000 ÷ 10,000 × 100 = 50.00%, and the growth multiple is 15,000 ÷ 10,000 = 1.5000x. The annualised ROI is (1.5)1÷5 − 1 = 8.45% a year — noticeably less than the 10% a year you would get by simply dividing 50% by 5, because a steady 10% compounded for five years would overshoot, ending at $16,105 rather than $15,000. The simple average profit, $1,000 a year, is shown in the breakdown for what it is: an average, not a rate. The target table underneath answers the reverse question for the same stake: a 10% ROI needs a final value of $11,000, 25% needs $12,500, 50% is the $15,000 entered, and 100% — a doubling — needs $20,000.
The same percentage is not the same investment
| Case | Invested | Final value | Years | Profit | ROI | Annualised |
|---|---|---|---|---|---|---|
| Worked example | $10,000 | $15,000 | 5 | $5,000 | 50.00% | 8.45% |
| Quick gain | $1,000 | $1,200 | 1 | $200 | 20.00% | 20.00% |
| A loss | $5,000 | $4,000 | 2 | −$1,000 | −20.00% | −10.56% |
| Doubling | $10,000 | $20,000 | 7 | $10,000 | 100.00% | 10.41% |
| House price rise | $200,000 | $260,000 | 5 | $60,000 | 30.00% | 5.39% |
| Same 50%, twice the wait | $20,000 | $30,000 | 10 | $10,000 | 50.00% | 4.14% |
Read the first and last rows against each other: identical 50.00% headlines, but spread over ten years instead of five the annualised return falls from 8.45% to 4.14% — less than half the pace. The loss row matters just as much: a fall from $5,000 to $4,000 is −20.00% overall and −10.56% annualised, and clawing back to break even from $4,000 needs a gain of 25%, not 20% — losses and gains are not symmetrical, a point the percent change calculator works through in full. The house row is the one to read with the limitations below in mind: a 30% price rise over five years is 5.39% annualised before interest, taxes, insurance and maintenance have had their say.
Reading an ROI figure honestly — the limits
Four cautions belong with any ROI. ROI counts only what you tell it. Leave buying and selling fees out of the two amounts and the return is flattered; leave dividends or rent out of the final value and it is understated. Measure both sides the same way for every investment you compare. It says nothing about risk or smoothness. The annualised figure pretends the growth arrived at a steady compounded pace; a holding that doubled, halved and recovered can share an ROI with one that never moved except upwards. It ignores inflation: 8.45% a year while prices rise 3% a year is a real gain of roughly five and a half points, not eight — the inflation calculator puts a number on the difference. And money added or withdrawn midway breaks the simple version: if you kept adding deposits, the honest measure is a money-weighted return (an IRR), which weighs each cash flow by how long it was invested. For a single amount in and a single value out — the job this page does — the arithmetic above is exact; past returns, in any form, never guarantee future ones.
Frequently asked questions
How is ROI calculated?
Subtract what you invested from the final value to get the profit, divide the profit by the amount invested, and multiply by 100. An investment of $10,000 that ends at $15,000 made $5,000, and 5,000 divided by 10,000 is 0.5 — an ROI of 50.00%. The formula is printed above the worked example on this page, and the calculator shows the profit, the percentage and the growth multiple together.
What is the difference between ROI and annualised ROI?
ROI is the total return over the whole period; annualised ROI spreads it into the steady yearly rate that, compounded, would produce the same result. A 50% return over 5 years annualises to 8.45% a year, and the same 50% over 10 years to just 4.14% — which is why annualised ROI is the fairer figure whenever two investments were held for different lengths of time. Simply dividing the total by the years (10% a year in the 5-year case) overstates it, because it ignores compounding.
Can ROI be negative?
Yes — whenever the final value is below what you put in. Dropping from $5,000 to $4,000 is an ROI of −20.00%. The most an investment can lose is −100%, which is a final value of zero: everything gone. Note that recovering from a loss takes a larger percentage gain than the loss itself — a 20% loss needs a 25% gain to break even, because the gain is measured against the smaller amount that remains.
What does an ROI of 100% mean?
That the investment doubled: the profit equals the entire amount invested, so the final value is twice the stake. $10,000 becoming $20,000 is a 100% ROI and a growth multiple of 2.0000x. Over 7 years that doubling annualises to 10.41% a year — the same relationship behind the rule of thumb that money doubles in roughly 72 divided by the annual rate, here about 7 years at about 10%.
Does ROI include fees, taxes and inflation?
Only if you put them in. This calculator measures the two amounts you enter, so the honest habit is to include buying fees in the amount invested and selling fees, and any income received, in the final value. Taxes depend on your situation and are not modelled, and inflation is not deducted — a nominal 8.45% annualised return in 3% inflation is worth roughly five and a half points a year in real terms. ROI is a comparison tool, not an after-tax statement.