One steady rate that tells the whole journey
Investments, revenues and savings balances almost never grow by the same percentage two years running — yet comparing them demands a single yearly figure. The compound annual growth rate, CAGR, is that figure: the constant yearly rate which, compounded, would carry the beginning value to the ending value in exactly the time available. It is the standard yardstick for comparing a fund against an index, a company's revenue growth against a rival's, or a savings balance against inflation, because it puts every journey — whatever bumps it had — onto the same per-year scale. This page returns the CAGR with the figures that keep it honest beside it: the total growth it summarises, the growth multiple, the simple average gain per year (a different, weaker number people often confuse with it), the doubling or halving time it implies, and the ending values that round-number rates of 5, 10, 15 and 20 percent would have produced instead, so you can feel what a point or two of CAGR is worth. It is the backward-looking partner of the compound interest calculator, which projects a rate forward; CAGR takes two real values and works the rate out backwards, and where the ROI calculator reports a total return and annualises it as a side figure, this page makes the annualised rate itself the headline and shows its working.
The formula, with every term defined
CAGR = (Ending value ÷ Beginning value)1 ÷ Years − 1Total growth = (Ending ÷ Beginning) − 1 · Multiple = Ending ÷ Beginning · Doubling time = ln 2 ÷ ln(1 + CAGR)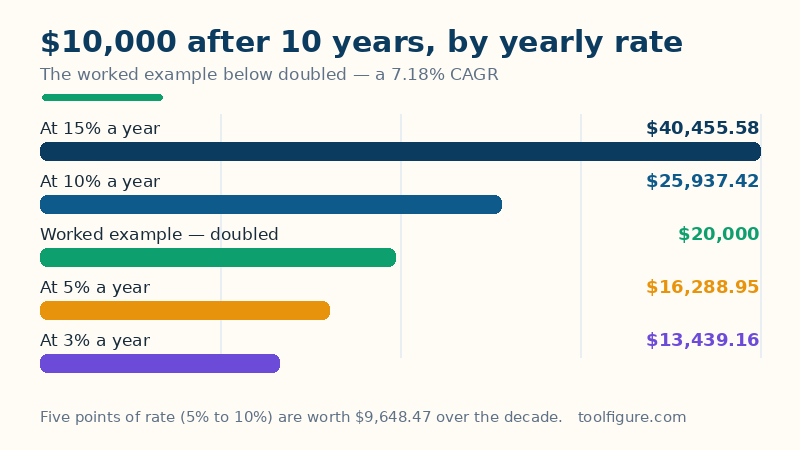
Read it in words. The ratio ending ÷ beginning is the growth multiple — how many times over the value multiplied (2.0000x means it doubled). Raising it to the power 1 ÷ years takes the years-th root: it asks what single yearly multiplier, applied that many times, compounds to the multiple. Subtracting 1 turns the multiplier into a rate — a multiplier of 1.0718 is a rate of 7.18%. The exponent is where the honesty lives: because the root is geometric, a gain of 50% followed by a loss of 50% does not average to zero under CAGR. The multiple is 1.5 × 0.5 = 0.75, so the two-year CAGR is 0.751/2 − 1 = −13.40% — the truth, since the money really did shrink by a quarter. An arithmetic average of the two yearly returns (+50 and −50) would report a flattering, false 0%. The doubling time follows from the same multiplier: solving (1 + CAGR)t = 2 gives t = ln 2 ÷ ln(1 + CAGR), the exact version of the Rule of 72 shortcut.
Worked example: $10,000 becomes $20,000 in 10 years
The defaults above enter a beginning value of $10,000, an ending value of $20,000 and 10 years. The multiple is 20,000 ÷ 10,000 = 2.0000x, and the tenth root of 2 is 1.071773…, so the CAGR is 7.18% (7.1773% before rounding). The checks close the example: compounding $10,000 at that unrounded rate for 10 years returns exactly $20,000, and the doubling time — ln 2 ÷ ln 1.071773 — is exactly 10.00 years, as it must be for a value that doubled in 10 years. The total growth is +100.00%, a gain of $10,000, and the simple average gain is $1,000 a year — correct as an average of dollars, but useless as a rate, because $1,000 is 10% of the beginning value and only 5% of the ending one. The Rule of 72 estimates the doubling time as 72 ÷ 7.18 ≈ 10.03 years, close to the exact 10.00. The target rows price the alternatives: over the same decade, 5% would have ended at $16,288.95, 10% at $25,937.42, 15% at $40,455.58 and 20% at $61,917.36 — the chart near the top draws that ladder, and the spread between the 5% and 10% rows ($9,648.47) is what five points of yearly growth are worth on $10,000 over ten years.
Five journeys, five CAGRs
| Journey | Multiple | Total growth | CAGR |
|---|---|---|---|
| $10,000 → $20,000 in 10 years — worked example | 2.0000x | +100.00% | 7.18% |
| $5,000 → $8,000 in 5 years | 1.6000x | +60.00% | 9.86% |
| $1,000,000 → $2,500,000 revenue in 3 years | 2.5000x | +150.00% | 35.72% |
| $50,000 → $40,000 in 4 years — a decline | 0.8000x | −20.00% | −5.43% |
| $100 → $1,000 in 20 years | 10.0000x | +900.00% | 12.20% |
| $10,000 → $10,000 in 10 years — flat | 1.0000x | 0.00% | 0.00% |
Three lessons sit in the table. The revenue row shows how demanding a big short-run CAGR is: two and a half times in three years needs 35.72% every year, a pace very few real businesses hold. The decline row shows CAGR working in reverse without complaint — −5.43% a year, at which pace the value would halve in 12.43 years — because a multiple below 1 has a perfectly good root. And the $100 row is the quiet one: turning $100 into $1,000 sounds dramatic, yet over 20 years it is a 12.20% CAGR — time, not brilliance, doing most of the lifting. Compare any row's CAGR with its total growth divided by its years and the gap is the whole point of the measure: 900% over 20 years is not 45% a year.
Reading a CAGR honestly — the limits
Four cautions belong with any figure from this page. CAGR smooths; it does not describe. Two funds can both post a 7.18% ten-year CAGR while one climbed steadily and the other halved twice and recovered — the risk lived through was entirely different, and CAGR alone cannot tell you which you are looking at. Pair it with the worst drawdown or the yearly figures before judging. Endpoints rule the answer. Start the clock at a crash bottom or end it at a bubble top and the CAGR flatters; shift either date a year and it can change by points. Honest reporting names the exact period, which is why this page asks you for it rather than assuming calendar years. CAGR assumes the growth compounds untouched. Real journeys leak — taxes, fees, withdrawals and, for a business, the cash that growth itself consumed — and none of that is inside two endpoint figures. And it is a nominal rate. Against 3% inflation, the worked example's 7.18% is a real, purchasing-power CAGR of (1.071773 ÷ 1.03) − 1 = 4.06% — the deflation step the inflation calculator performs from the other side. None of this makes CAGR a bad measure; it makes it a summary, and summaries are for comparing, not for concluding.
Frequently asked questions
What is the difference between CAGR and the average annual return?
The average (arithmetic mean) adds the yearly returns and divides by the count; CAGR compounds them. For +50% then −50%, the average is 0% — yet $100 becomes $150, then $75, a real loss of a quarter. The CAGR is (0.75)^(1/2) − 1 = −13.40%, the steady yearly rate that actually connects $100 to $75. Whenever returns multiply money — which is always — the geometric CAGR is the truthful summary and the arithmetic average overstates it, more so the wilder the swings.
What CAGR do I need to triple my money in 10 years?
11.61%. Tripling is a multiple of 3, and 3^(1/10) − 1 = 0.1161. Enter $10,000 growing to $30,000 over 10 years above and the calculator returns exactly that. The same method answers any target: doubling in 10 years needs 7.18% (this page's worked example), doubling in 5 years needs 14.87%, and doubling in 20 years needs only 3.53% — the years do as much work as the rate.
How does the Rule of 72 relate to CAGR?
The Rule of 72 estimates doubling time as 72 divided by the yearly percentage rate: at the worked example's 7.18% it gives 72 ÷ 7.18 ≈ 10.03 years, against the exact ln 2 ÷ ln(1.0718) = 10.00 years this page computes. The rule is a mental shortcut that is most accurate near 8%; the calculator's doubling-time row is the exact figure, and for a negative CAGR it reports the halving time instead — at −5.43%, a value halves in 12.43 years.
Can CAGR be negative, and what does it mean?
Yes — a beginning value larger than the ending value gives a multiple below 1, whose root is a multiplier below 1: a rate below zero. The table's $50,000 → $40,000 over 4 years gives −5.43%, meaning the value shrank as if by 5.43% every year. A CAGR of exactly −100% is the floor and happens only when the ending value is zero. What CAGR cannot handle is a beginning value of zero or negative — there is no rate that grows nothing into something — so the calculator asks for a positive start.
What is the difference between CAGR, ROI and compound interest?
They answer three different questions about growth. ROI asks how much a finished investment returned in total — profit over cost — with the annualised version as a secondary figure. Compound interest projects forward: given a rate, what will this sum become? CAGR works backwards from two real values: given what a sum was and what it became, what steady rate connects them? Use CAGR to judge something that already happened, compound interest to model something that has not, and ROI when the total profit matters more than the pace. Our ROI and compound interest calculators are linked from this page.