The point where a business stops losing money
Every product carries two kinds of cost. Fixed costs — rent, salaries, insurance, software — arrive in full whether you sell one unit or a thousand. Variable costs — materials, packaging, shipping, per-sale fees — arrive one unit at a time, and only when a sale happens. The break-even point is the sales volume where the money coming in first covers both kinds completely: below it the business is subsidising every sale out of its own pocket, above it every further sale earns its margin as profit. It is the first number a new product, shop or service should be tested against, because it converts a vague hope — \u201cwe will sell plenty\u201d — into a countable target: this many units, this much revenue, by this date. The profit margin calculator answers the neighbouring question for a single sale already made; this page answers it for the whole period, before the sales happen.
The formulas, with every term defined
Contribution margin = selling price per unit \u2212 variable cost per unitBreak-even units = fixed costs \u00f7 contribution marginBreak-even revenue = break-even units \u00d7 selling price \u00b7 Units for a target profit = (fixed costs + target profit) \u00f7 contribution margin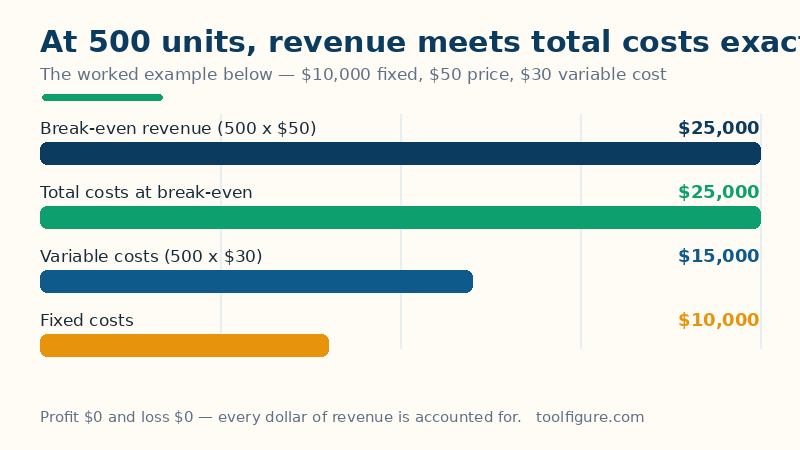
Read it in words. Out of every sale, the variable cost is spoken for first — it was spent making that unit. What remains, the contribution margin, is the only money available to pay the fixed costs, which is why it is called a contribution: each unit contributes that much towards the fixed pile. Dividing the fixed pile by the contribution counts exactly how many contributions are needed to clear it — that count is the break-even volume. The contribution margin ratio restates the same margin as a share of the price (here $20 of a $50 price is 40%), and break-even revenue can equally be found as fixed costs \u00f7 that ratio. A target profit needs no new idea: treat the profit you want as one more fixed cost to be covered, and the same division returns the larger volume that covers both. Past break-even, profit at any volume is simply units \u00d7 margin \u2212 fixed costs, which is how the expected-sales row in the result is built.
Worked example: $10,000 fixed, $50 price, $30 variable cost
The defaults above enter fixed costs of $10,000, a selling price of $50 and a variable cost of $30 per unit. The contribution margin is $50 \u2212 $30 = $20 — a 40.00% margin ratio. The break-even volume is $10,000 \u00f7 $20 = 500 units, and the break-even revenue is 500 \u00d7 $50 = $25,000. The check is the whole point of the page, and it closes exactly: at 500 units the variable costs are 500 \u00d7 $30 = $15,000, the fixed costs are $10,000, and $15,000 + $10,000 = $25,000 — every dollar of the break-even revenue is accounted for, profit $0 and loss $0, as the chart near the top draws it. The two optional rows extend the same arithmetic: a $5,000 target profit needs ($10,000 + $5,000) \u00f7 $20 = 750 units ($37,500 of revenue), and selling 800 units earns 800 \u00d7 $20 \u2212 $10,000 = $6,000 of profit on $40,000 of revenue.
How the break-even point moves
| Case | Margin | Break-even units | Break-even revenue |
|---|---|---|---|
| Worked example — $10,000 fixed, $50 price, $30 variable | $20 | 500 | $25,000 |
| $5,000 fixed, $25 price, $15 variable | $10 | 500 | $12,500 |
| $20,000 fixed, $100 price, $60 variable | $40 | 500 | $50,000 |
| $12,000 fixed, $80 price, $50 variable | $30 | 400 | $32,000 |
| $3,000 fixed, $15 price, $9 variable | $6 | 500 | $7,500 |
| Worked example, variable cost rises to $40 | $10 | 1,000 | $50,000 |
Two patterns repay attention. The margin, not the price, does the work: the first three rows have prices of $25, $50 and $100, yet all break even at 500 units, because in each case the margin and the fixed costs stand in the same proportion — a premium price with premium costs is no safer than a cheap product with cheap costs. And a squeezed margin punishes twice: the last row changes only the variable cost, from $30 to $40, and the break-even volume doubles from 500 to 1,000 units — halving the margin doubles the sales the business must find before it earns a cent, which is why a supplier's small price rise can matter more than a large advertising decision. Fixed costs work the plainest way of all: double them and the break-even volume doubles, because twice the pile needs twice the contributions. The ROI calculator then judges whether the profit above break-even was worth the capital tied up in earning it.
Reading a break-even figure honestly — the limits
Four cautions belong with any figure here. Whole units round up: when the division is not exact — $9,000 of fixed costs at an $18 margin gives exactly 500, but $10,000 at a $30 margin gives 333.33 — you cannot sell a third of a unit, so the result also shows the break-even volume rounded up to the next whole unit; the unrounded figure is the mathematical point, the rounded one is the sales target. The split between fixed and variable is a simplification: real costs include stepped costs (a second staff member at 600 units) and semi-variable bills (electricity with a standing charge), and forcing them into two boxes moves the answer — put a doubtful cost in fixed if it must be paid regardless. One product, one price: the formula assumes every unit sells at the same price with the same variable cost; discounts, returns and a product mix each with its own margin need the calculation run per line, or with an honestly weighted average margin. And break-even is a floor, not a plan: reaching it means profit of exactly zero — no return on the owner's capital or time, which the target-profit input exists to correct: set the profit the period must produce, and aim at that volume instead.
Frequently asked questions
What is the break-even point, in plain words?
The sales volume at which total revenue exactly equals total costs — the business has neither made nor lost money. On the worked example, 500 units sold at $50 bring in $25,000, which exactly covers $15,000 of variable costs plus $10,000 of fixed costs. Every unit sold beyond that point contributes its full margin as profit; every unit short of it leaves that much of the fixed costs unpaid.
How do I work out my contribution margin?
Subtract the variable cost of one unit from its selling price: $50 \u2212 $30 = $20 on the worked example. Variable cost is everything that is spent because that one unit was made or sold — materials, packaging, shipping and per-sale card or platform fees — and nothing that would be spent anyway. As a share of price it is the margin ratio: $20 \u00f7 $50 = 40%, the figure that also gives break-even revenue directly as fixed costs \u00f7 40%.
Why can a product never break even when its variable cost is at or above its price?
Because each sale then contributes zero or less towards the fixed costs. At a $50 price and a $50 variable cost, selling ten units or ten thousand units leaves the same $10,000 of fixed costs entirely unpaid; above $50 of variable cost, every extra sale deepens the loss. This calculator refuses that case with an explanation instead of printing a meaningless volume — the only fixes are a higher price, a lower variable cost, or not selling the product.
How many units do I need for a specific profit, not just break-even?
Add the profit to the fixed costs and divide by the same margin — the profit behaves exactly like one more fixed bill to be covered. For a $5,000 profit on the worked example: ($10,000 + $5,000) \u00f7 $20 = 750 units, $37,500 of revenue. The check closes the same way: 750 \u00d7 $20 of contributions = $15,000, which pays the $10,000 fixed costs and leaves exactly the $5,000.
Is break-even the same as recovering my start-up investment?
No — it covers the costs of one period, not the capital spent before trading began. A shop that breaks even monthly has paid its rent, staff and stock, but the fit-out and deposits are still unrecovered. Track that separately: divide the start-up capital by the monthly profit above break-even (the expected-sales row shows that profit) to get the months to payback, and use the ROI calculator to judge the return on the whole sum invested.