What "how much house can I afford" really asks
A lender answering that question does not look at your savings account first — it looks at two ratios. The front-end ratio caps the housing payment itself (principal, interest, taxes, insurance and HOA) at 28% of gross monthly income. The back-end ratio caps everything — housing plus car loans, cards, student loans and any other monthly debt — at 36%. Whichever is tighter rules your answer: a debt-free earner is bound by the 28%, while someone carrying debts can be bound by the 36% even with a generous salary. This calculator applies both caps in the open and names which one is doing the limiting, so the result explains itself. It sits beside the mortgage calculator, which prices any loan you type in, and the down payment calculator, which works the other direction — what a chosen price demands up front.
The method, with every term defined
Max housing payment = min( 28% × gross monthly income, 36% × gross monthly income − other monthly debts )Loan = ( payment − insurance/12 − HOA − tax×down/12 ) ÷ ( P&I factor + tax/12 )P&I factor = r ÷ ( 1 − (1+r)-n ), r = rate/12, n = years × 12 · Price = loan + down payment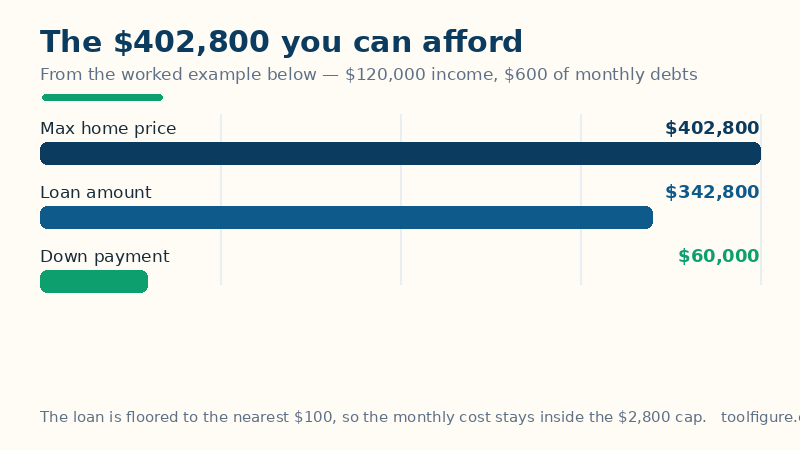
The monthly P&I factor is the standard loan payment formula from the loan calculator page: it turns any annual rate and term into the monthly payment per dollar borrowed. The rearrangement above runs it backwards — from the payment the 28/36 rule allows, through to the loan that payment buys. Note what the formula subtracts before the loan is sized: the month's insurance and HOA, and the property tax due on the down-payment slice of the price, because tax is charged on the whole price, not just the borrowed part. The loan is then rounded down to the nearest $100, deliberately, so the recommended price can never push the monthly cost a cent past the cap — conservative rounding on a decision this size is a feature, not laziness.
Worked example: $120,000 income, $600 of monthly debts
The defaults above are a household earning $120,000 a year — $10,000 a month — with $600 of monthly debts, a $60,000 down payment, a 7% rate over 30 years, a 1.1% property tax rate, $1,800 a year of insurance and no HOA. The front-end cap is 28% of $10,000 = $2,800; the back-end cap is 36% of $10,000 minus $600 = $3,000. The tighter of the two, $2,800, is the housing payment. At 7% over 30 years the P&I factor is 0.0066530 per dollar borrowed; solving the rearranged formula gives a loan of $342,814, which floors to $342,800. Add the down payment and the affordable price is $402,800. The monthly cost at that price is $2,280.66 of principal and interest, $369.23 of property tax, $150.00 of insurance — $2,799.89 in total, a cent under the cap because of the conservative loan rounding. The down payment is 14.90% of the price; the housing ratio reads 28.00% and the back-end ratio 34.00%, both under their ceilings, exactly as the rules require.
Four households, four different binding caps
| Income / debts / down payment | Affordable price | Monthly cost | Binding cap |
|---|---|---|---|
| $120,000 / $600 / $60,000 — worked example | $402,800.00 | $2,799.89 | 28% front-end |
| $80,000 / $500 / $40,000 (7%, 30yr, 1.1% tax) | $261,900.00 | $1,866.38 | 28% front-end |
| $150,000 / $800 / $100,000 (6.5%, 30yr, 1.2% tax) | $537,100.00 | $3,499.87 | 28% front-end |
| $60,000 / $900 / $20,000 (7.5%, 30yr, 1.0% tax, $50 HOA) | $110,500.00 | $899.87 | 36% back-end |
The last row is the cautionary tale the calculator exists for: the $60,000 earner is bound by the back-end cap — $900 of existing debts eats so much of the 36% allowance that housing itself is squeezed to an 18.00% ratio while the back-end ratio sits exactly at 36.00%. Compare the middle two rows and watch the rate matter: the $150,000 earner gets more than double the $80,000 earner's price, not only from the higher income but from the half-point better rate, which is why the rate box deserves as much attention as the income box. The HOA row also shows why the field exists — $50 a month is $18,000 of price over a 30-year loan.
How to read your result — and its limits
Treat the price as a ceiling under one set of rules, not a target: a lender may apply different ratios, and comfort is a stricter test than the 28% — many advisers suggest keeping housing at 25% of take-home pay, which is a smaller number than 28% of gross. Four limits are stated plainly here because they change real answers. Private mortgage insurance is not included: with less than 20% down most lenders add PMI, which this page omits — so a sub-20% result understates the true monthly cost, and the gap can be several hundred dollars. Taxes vary wildly: 1.1% is a middle-of-the-road figure, but real effective rates run from under 0.5% to over 2% by location, and this page only knows what you type. The rule is not a law: some lenders stretch to 31/43 or beyond, and some buyers should not go near it — the rent calculator is the right page when renting beats buying. Ownership costs beyond PITIA are real: maintenance (roughly 1% of the price a year), utilities and moving costs never appear in a lender's ratio. What this page guarantees is the arithmetic: given your figures and the 28/36 rule, every number above follows exactly as written — and the debt payoff calculator shows what clearing the other-debts line first does to the answer.
Frequently asked questions
What is the 28/36 rule in the house affordability calculator?
It is the two-cap rule lenders have used for decades. The front-end cap allows at most 28% of gross monthly income for the housing payment (principal, interest, taxes, insurance and HOA). The back-end cap allows at most 36% of gross monthly income for all debts, housing included. The calculator applies both and uses the tighter one: with the worked example's $120,000 income and $600 of debts, the caps are $2,800 and $3,000, so the 28% front-end cap binds.
How does the calculator turn a monthly payment into a home price?
It works the standard loan payment formula backwards. The P&I factor r/(1-(1+r)^-n) with r = 7%/12 and n = 360 is 0.0066530 per borrowed dollar. The affordable payment ($2,800) minus the insurance, HOA and the property tax on the down-payment slice is divided by (P&I factor + tax/12); that gives the loan ($342,814 in the worked example), which is floored to $342,800, and adding the $60,000 down payment gives the $402,800 price. The monthly cost at that price — $2,280.66 P&I, $369.23 tax, $150.00 insurance — sums to $2,799.89, exactly the parts added, just under the cap.
Why is my affordable price lower than I expected — what binds it?
The result table names the binding cap, and the common culprit is the 36% back-end cap: existing debts eat the allowance housing would otherwise take. In this page's $60,000-income example, $900 of monthly debts binds the back-end cap so hard that housing is squeezed to an 18.00% ratio while the back-end ratio reads exactly 36.00%. The fix is arithmetic, not wishful thinking: clear the debts (see the debt payoff calculator), raise the down payment, or accept a cheaper price.
Does the affordable price include private mortgage insurance (PMI)?
No, and that is a deliberate stated limit. PMI is charged by most lenders when the down payment is under 20% of the price, and it can add several hundred dollars a month — none of it appears in this page's breakdown. In the worked example the $60,000 down payment is 14.90% of the $402,800 price, so a real lender's quote would run higher than the $2,799.89 shown. Re-run the numbers with a 20%-or-more down payment to see a price the lender quotes without PMI, or treat a sub-20% result as understating the true cost.