Three averages, three different questions
Ask a class, a sales team or a pay review for "the average" and the honest reply is: which one? The mean shares the total out equally, so every value pulls on it — including the one freak value. The median is the middle value of the sorted list, so a freak value at either end cannot move it at all. The mode ignores size completely and reports only frequency: the value that shows up most. This page computes all three side by side, with the sorted list printed in the result so the median and mode can be verified by eye, and it sits deliberately beside the average calculator, which works the mean alone in depth, and the standard deviation calculator, which measures how far the values spread around that mean.
The method, with every term defined
Mean = sum of all values ÷ count · Median = the middle value of the sorted list (or the mean of the two middle values)Mode = the value with the highest frequency · Range = maximum − minimum · Midrange = ( minimum + maximum ) ÷ 2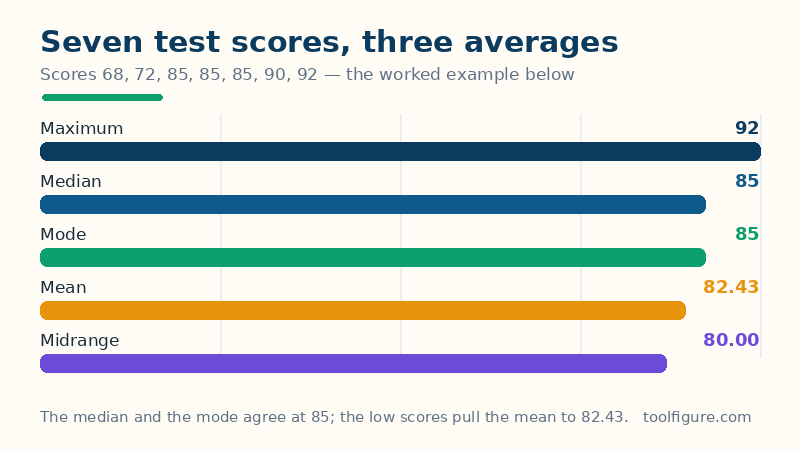
Sorting comes first — the median and the range are read off the sorted list, never the order the numbers were typed in. With an odd count, the median is the single middle value, position (count + 1) ÷ 2. With an even count there is no single middle, so the median is the mean of the two values either side of the centre. The mode is a frequency contest: count how often each distinct value appears and the highest count wins. If two or more values tie at the top, the list honestly has several modes (two is called bimodal); if every value appears just once, there is no mode, and this page says so instead of dressing the first value up as one. The midrange — halfway between the extremes — is shown because it is the easiest of all to fool: it uses only two values in the whole list.
Worked example: seven test scores
The defaults above are one student's seven test scores: 72, 85, 85, 90, 68, 85, 92. Sorted, they read 68, 72, 85, 85, 85, 90, 92. The sum is 577, so the mean is 577 ÷ 7 = 82.43. With seven values the middle one is the 4th, so the median is 85. The value 85 appears three times and nothing else repeats, so the mode is 85. The range is 92 − 68 = 24 and the midrange is (68 + 92) ÷ 2 = 80.00. Read together, the three averages tell a fair story: a typical score is 85, the equal-share average is dragged a little below it by the 68 and 72, and the most common single result is 85 — three views of the same list, none of them wrong, each answering its own question.
Other lists, including the cases that trip people up
| List | Mean | Median | Mode | Range |
|---|---|---|---|---|
| 1, 2, 3, 4, 5 | 3.00 | 3.00 | No mode | 4.00 |
| 68–92 test scores — worked example | 82.43 | 85.00 | 85 | 24.00 |
| 10, 20, 30, 40, 100 | 40.00 | 30.00 | No mode | 90.00 |
| 3, 7, 7, 7, 9, 11 | 7.33 | 7.00 | 7 | 8.00 |
| 1, 2, 2, 3, 3, 4 (bimodal) | 2.50 | 2.50 | 2, 3 | 3.00 |
| 5, 5, 5, 5 | 5.00 | 5.00 | 5 | 0.00 |
The third row is the lesson this page exists for: replace the last value of an even climb with one large 100 and the mean leaps to 40.00 while the median stays at 30.00 — the mean followed the outlier, the median did not notice it. That gap between mean and median is the standard quick test for skew: mean above median means a long tail of high values is pulling the average up (the shape of incomes in most countries, which is why official statistics quote the median), and mean below median means the pull is coming from the low end, as in the test scores above. The last row makes the opposite point — when the list is constant, all three averages agree and the range is honestly zero.
How to read your result — and its limits
Quote the average that matches the question. For anything that will be shared out or totalled — budgets, per-person costs, average rainfall — the mean is the one that rebuilds the total (mean × count = sum), and the mode and median cannot. For a typical case in a skewed list — house prices, wages, delivery times with a few disasters in them — the median is the honest centre. For stocking, sizing and categories — the shoe size to order most of, the most common journey length — only the mode answers. Three limits belong with the page. Small lists swing: with three or four values, one new entry can move the mean by a lot and flip the mode entirely, so treat summaries of tiny lists as descriptions, not patterns. The mean of grouped data is an estimate: if your numbers are already class averages or bracket midpoints, the mean of them weights every bracket equally, which the raw data would not. And no average sees shape: two lists can share a mean, median and mode while one clusters tightly and the other sprawls — that spread is a separate measurement, and the standard deviation calculator is the page that takes it. What this page guarantees is the counting itself: given the list, every figure follows exactly as written above.
Frequently asked questions
What is the difference between the mean, median and mode?
They are three different centres of the same list. The mean adds every value and divides by the count (577 / 7 = 82.43 in the worked example), so every value — including extremes — pulls on it. The median is the middle value of the sorted list (85 in the example), which extremes cannot move. The mode is the most frequent value (85 again, appearing three times), which ignores size entirely. When a list is symmetrical all three tend to agree; when they disagree, the list is skewed, and the gap itself is information.
How do you find the median with an even number of values?
Sort the list and average the two values either side of the centre. The bimodal row of the table on this page shows it: 1, 2, 2, 3, 3, 4 has six values, the two middle ones are 2 and 3, and the median is (2 + 3) / 2 = 2.50 — a value that need not appear in the list at all. With an odd count there is a single middle value instead: position (count + 1) / 2 of the sorted list.
Can a list have more than one mode, or no mode?
Both. A list has one mode per value tied at the highest frequency: 1, 2, 2, 3, 3, 4 is bimodal, with modes 2 and 3 appearing twice each. And when every value appears exactly once — 1, 2, 3, 4, 5, for example — no value is more frequent than any other, so the list has no mode. This calculator reports both cases plainly rather than forcing a single answer: a mode that is an artefact of the software helps nobody.
Why is the median used for house prices and incomes instead of the mean?
Because a few very large values drag the mean upward without changing what is typical. In this page's own example, the list 10, 20, 30, 40, 100 has a mean of 40.00 but a median of 30.00 — four of the five values sit at or below 40, and the single 100 does all the lifting. A street with one mansion works the same way: the median house price describes the middle home sold, while the mean describes a home that may not exist. That is why official price and wage statistics are usually medians.