The three lines behind every solar quote
A rooftop system is sized backwards from your bill. First, your annual use: monthly kilowatt-hours times twelve. Second, the system size in kilowatts — the peak sun hours at your location and the real-world losses decide how many kilowatts it takes to make that energy in a year. Third, the panel count — kilowatts divided by one panel's wattage, always rounded up, because you cannot buy part of a panel:
system size (kW) = annual kWh ÷ (peak sun hours × 365 × (1 − losses))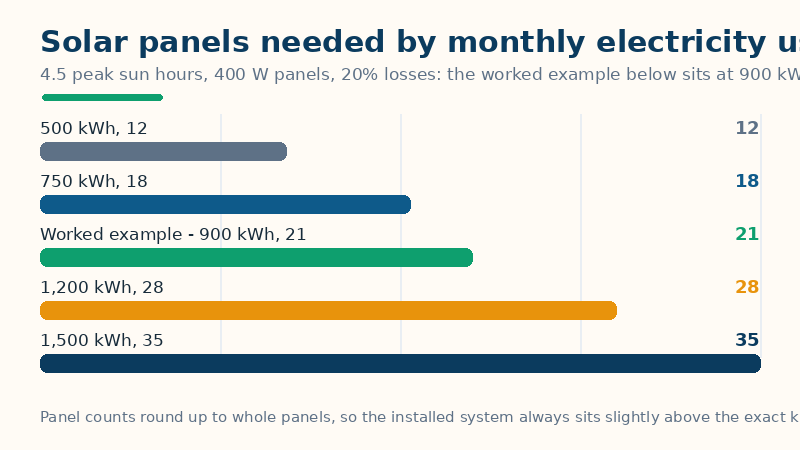
panels = system size (W) ÷ panel wattage, rounded upyearly production = installed kW × peak sun hours × 365 × (1 − losses)Peak sun hours deserve a sentence of their own, because they are the most misunderstood input on the page. They are not daylight hours and not the hours the sun is visible: one peak sun hour is one hour of sunlight at the full standard intensity of 1,000 watts per square metre. A cloudy northern city can have 14 hours of daylight but only 3.5 peak sun hours, while a desert city with the same daylight reaches 6.5. That is why the same 900 kWh a month needs 27 panels at 3.5 sun hours, 21 at 4.5, 17 at 5.5 and only 15 at 6.5 — the sun, not the roof, sets the count. The 20% default loss covers the real-world gap between a panel's laboratory rating and what reaches your meter: heat (panels lose output as they warm), inverter conversion, wiring, soiling and the occasional shaded hour; installers commonly use 14–25% here, and the calculator lets you set your own figure rather than hiding it.
Worked example: 900 kWh a month, 4.5 sun hours, 400 W panels
Annual use = 900 × 12 = 10,800 kWh. System size = 10,800 ÷ (4.5 × 365 × 0.80) = 10,800 ÷ 1,314 = 8.22 kW. Panels = 8,219 W ÷ 400 W = 20.55, rounded up to 21 panels, so the installed system is 21 × 400 W = 8.4 kW — slightly above the 8.22 kW target, which is the rounding-up effect and is normal. Yearly production = 8.4 × 4.5 × 365 × 0.80 = 11,037.6 kWh, which is 102.2% of the 10,800 kWh used: the rounded-up system overproduces by a little, as it must. Roof area = 21 × 21.5 sq ft = 451.5 sq ft (41.9 m²), using the standard 400 W panel footprint of about 21.5 sq ft; plan extra for walkways, fire-code setbacks and shaded patches, which is why installers measure usable roof rather than total roof. Installed cost = 8.4 kW × $3.00 per watt = $25,200 before any incentive. Yearly saving, if every generated kWh offsets a kWh bought at $0.17, = 11,037.6 × $0.17 = $1,876.39, so simple payback = $25,200 ÷ $1,876.39 = 13.4 years. The calculator's table shows the same method at other monthly uses (4.5 sun hours, 400 W, 20% losses): 500 kWh → 12 panels (4.8 kW), 750 kWh → 18 panels (7.2 kW), 1,200 kWh → 28 panels (11.2 kW), 1,500 kWh → 35 panels (14.0 kW).
How to read your result, and its limits
Four cautions keep the quote honest. First, the payback assumes every generated kWh is worth the full retail rate. Where your utility credits exported electricity below what you pay — net billing rather than full net metering — the evening kWh you still buy costs more than the midday kWh you sell, and the real payback stretches well past the simple figure; the saving line is an upper bound, not a promise. Second, production is an annual average, not a monthly promise: the same system makes far more in June than in December, and a system sized to 102% of annual use still buys grid power on winter evenings. Third, roof area here is panel area only: setbacks, vents, chimneys and shading cut the usable roof, so a roof that looks big enough on paper can still hold fewer panels. Fourth, this is a sizing estimate, not an installation design: panel orientation, tilt, inverter choice, local permits and incentives all change the final quote — run your exact address through a tool like NREL's PVWatts before signing anything. For what the electricity itself costs today, the electricity cost calculator prices your current use; for what the system avoids in emissions, the carbon footprint calculator totals a household's CO2.
Common mistakes
- Using daylight hours instead of peak sun hours. Fourteen hours of daylight is not fourteen peak sun hours. Using daylight inflates production by roughly three times and sizes a system far too small. Use a solar map figure for your location.
- Forgetting the losses. Sizing at 0% losses (dividing by sun hours × 365 alone) undersizes the system by a fifth at the 20% default — the 900 kWh example would wrongly come out at 17 panels instead of 21.
- Sizing to a single month's bill. One summer or winter bill misleads in both directions. Use the average monthly use across twelve bills, or the annual total divided by twelve.
- Treating the payback as guaranteed. Rates change, incentives expire, panels degrade slowly (typically under 1% a year), and export credits vary by utility. The payback is a comparison figure for quotes, not a contract.
Related tools: UV Index Calculator — How strong the sun's ultraviolet is where you are — a clear-sky UV index estimate from your place, date and time, with its protection band.
Frequently asked questions
How many solar panels do I need for my home?
Divide your annual use by your local peak sun hours, 365 days and the real-world loss factor to get kilowatts, then divide by one panel's wattage and round up. At the worked example — 900 kWh a month, 4.5 peak sun hours, 400 W panels, 20% losses — that is 8.22 kW, or 21 panels (8.4 kW installed).
What are peak sun hours?
One peak sun hour is one hour of sunlight at the full standard intensity of 1,000 watts per square metre. A location's daily peak sun hours — typically 3.5 to 6.5 for most homes — are the total solar energy for the day expressed in those equivalent full-strength hours, not the hours of daylight.
How much roof space do solar panels need?
About 21.5 square feet per standard 400 W panel, so the worked example's 21 panels need 451.5 sq ft of panel area (41.9 m²), before walkways, setbacks and shaded patches. Usable roof is always less than total roof.
How long until solar panels pay for themselves?
Simple payback is installed cost divided by yearly bill saving. At the worked example — $25,200 installed, $1,876.39 saved a year if every generated kWh offsets a purchased kWh — that is 13.4 years. Where export is credited below the retail rate, the real payback is longer.